Understanding capnography and being able to decipher the waveforms, can give us critical information on a patient’s condition, early. Below are 3 cases, where we look at some of the potential waveforms we might encounter in the intubated patient in the emergency department.
What does it tells us?
Capnography gives information on:
- Metabolism: Responsible for the production of CO2.
- Perfusion: Transport of CO2 occurs.
- Ventilation: The expulsion of CO2 requires ventilation.
Gas movement occurs across a pressure differential. The partial pressure of oxygen in air is at its highest. As it moves through the lungs into the cappilaries and end organs, it does so down a pressure gradient. As oxygen is metabolised, CO2 is produced. This moves through the body as HCO3-, until it reaches the lungs and is then expelled as CO2.
The Basic Waveform
The waveform is a rectangular shape that has 3 phases. It is the result of transport of CO2 and ventilation, its amplitude being a direct result of the level of cardiac output. The normal Range of Co2 is 35-45mmHg and this is measured at the ‘end-tidal’ point of the alveolar plateau(as described below).
Phases of the waveform
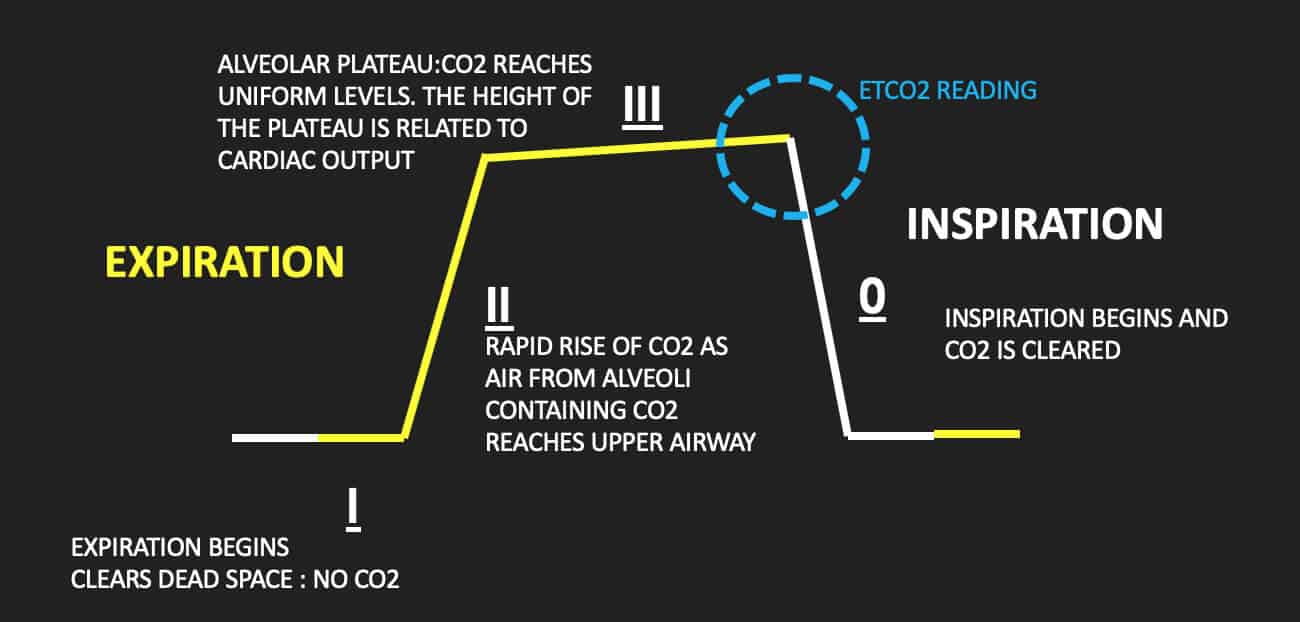
Phase I: Expiration begins. This clears the dead space where no CO2 is produced.
Phase II: There is a rapid rise in CO2 as expiration continues. This is due to CO2 from the alveoli now reaching the upper airway.
Phase III: This is the alveolar plateau. Co2 reaches uniform levels here. The height of the plateau is related to the cardiac output and the ETCO2 is measured at the end of expiration.
Phase 0: This is the inspiration phase where CO2 levels drop.
CASES
Patient 1
25 year old male brought in by ambulance following an overdose.
The patient’s conscious state has dropped during ambulance transport and his GCS on arrival is 7. He is haemodynamically stable. The decision is made to intubate. The patient has been pre-oxygenated and apnoeic oxygenation has been applied. The registrar performs rapid sequence intubation, using propofol and rocuronium. Using direct laryngoscopy, the experienced registrar passes the endotracheal tube(Ett). There is misting of the tube and appropriate chest wall movements following intubation.
End tidal Co2(EtCO2) is attached and the following waveform is obtained. What does it show? What is the cause?

This is the classic waveform produced in oesophageal intubation. There is a progressive decrease in the EtCO2 waveform. A minimum of 6 waveforms must occur, to ensure that the tube is in the right place.
The same waveform can occur in an obstructed Ett, however in this case oesophageal intubation needs to be assumed. Gentle bagging suction would resolve an obstruction.
Why can’t this be an obstruction. Didn’t the registrar see misting of the Ett and the chest rise?
We know that there is misting of the Ett in about 80% of cases of oesophageal intubation. There can also be chest wall rise and in about 15% of cases, breath sounds are misinterpreted as coming from the lungs when they are transmitted sounds.(1)
The decision is made to remove the Ett and re-intubate. The second intubation attempt appears to be successful. The Ett is 24cm at the lip. The following waveform is seen below. What does this indicate?


Radiopedia.com
The stepped waveform seen above is the product of two waveforms. The tube is most likely, in the right main bronchus. There is an initial reading from the right side of the lung and then the additive CO2 from the left lung.
On auscultation of the chest there is decreased air entry on the left. If we wait for the chest x-ray and don’t pick this up early, it will look like this example on the left. More importantly, the patient will begin to desaturate and present an oxygenation challenge.
The Ett was pulled back 2cm and the waveform normalised to that shown below.

The patient is transported to the CT scanner for a brain CT.
30 minutes later he arrives back to the resuscitation cubicle. The registrar asks for help as the ventilator is alarming. The capnograph is shown below. What is the issue?

This ‘shark fin’ pattern is classically found in two conditions:
- Bronchospasm and
- Obstruction
You auscultate the chest and although there are decreased breath sounds bilaterally, there is no wheeze. The Ett is suctioned and the waveform once again returns to normal. You assume this to have been an obstruction of the tube.
Patient 2
The ambulance bring in a 62 year old male patient involved in a motor vehicle accident.
His only major injury appears to be a large scalp laceration. Vitals are essentially normal HR 105, BP 115/65, sats are 98% on a Hudson mask and the patient is slightly confused, giving a GCS or 14. He cannot give an accurate medication history although tells you that his past history has been a cardiac infarction and hypertension. On Primary and secondary examination, the only other findings are a seatbelt mark across the chest with a very painful left chest wall.
Whilst preparing to send the patient to the CT scanner for a CT brain and cervical spine, his conscious state decreases rapidly. His GCS falls below 9 and the decision is made to intubate prior to CT.
 The registrar uses propofol and suxamethonium for intubation. The Ett is successfully passed and a capnograph showing an appropriate trace is obtained.
The patient is taken to CT and whilst there, the decision is made to PAN SCAN. Following transfer onto the CT table the ventilator alarms. You silence the alarm but notice that the capnograph waveform has changed to that shown below. What does this indicate?

The alveolar plateau is downsloping here. It can’t be maintained, as air is leaking from the lung. This can occur in two conditions:
- Pneumothorax and
- Emphysema
The patient then begins to drop saturations and blood pressure. You auscultate the lungs and notice markedly reduced breath sounds on the left side. The assumption is that there is a pneumothorax, now exacerbated by intubation and clinically causing tension. Finger thoracostomy is performed in the CT room and the vitals and waveform return to normal. The patient is scanned and returned to the resuscitation cubicle for a formal chest tube insertion. CT scan has shown a large subdural haemorrhage, a remnant left sided pneumothorax and three left sided fractured ribs. The trauma team are aware. You call Neurosurgery and ICU on your way back to the Emergency Department.
On returning to the resuscitation cubicle, the nurse points out to you that the patient is moving a little. You notice that the capnograph waveform has once again changed, to that shown below. What does this indicate?
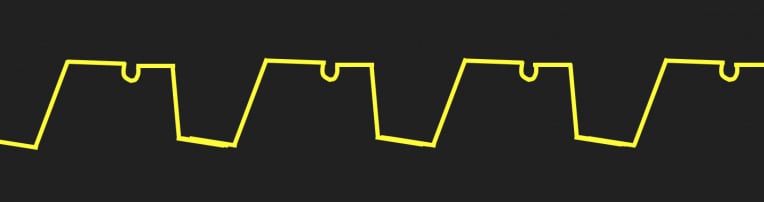
The small dip in the alveolar plateau is known as the ‘curare cleft’. It indicates that the paralysis is wearing off and the patient taking their own breaths. You decide to paralyse the patient, given the head injury. The neurosurgical team arrive and decide to take the patient to the operating room.
Patient 3
A 28 year old woman who is 3 weeks post partum is brought in by ambulance.
She has had a sudden feeling of dyspnea and has developed left sided pleuritic chest pain in the last hour, whilst having lunch at a restaurant with some friends. Prior to ambulance arrival she has suffered an episode of syncope.
On arrival her saturations are 82% on a rebreather mask. You are suspecting a pulmonary embolism(PE) and have asked the ECHO tech to come to the emergency department to confirm the diagnosis on ECHO, and to determine if thrombolysis should be offered. The patient continues to deteriorate and the decision is made to intubate.
Post successful intubation and as the ECHO tech is performing a scan the capnograph is shown below. What does this indicate?

This capnograph confirms the suspicion of a PE. In PE there is a decrease in perfusion of a part or parts of the lung(s), however ventilation remains the same. Thus there is an effective increase in alveolar dead space, so that expired CO2 decreases but PaCO2 is increased (2).
The ECHO confirms that there are criteria to indicate a large pulmonary embolism. As the tech is finishing up, the patient’s arterial line, blood pressure reading drops markedly, but there is a sinus rhythm shown on the monitor. The ECHO confirms there is no cardiac activity. The patient is in Pulseless Electrical Activity(PEA). High quality CPR is immediately commenced, as you prepare to give thrombolysis. You aim for slightly deeper compression, with the theoretical motive of helping break up the clot.
Cardiac arrest secondary to a cardiac cause, such as ischaemia results in ventricular tachycardia. However PEA or systole are the commonest arrest presentations in patients with PE. Cardiac arrest in the PE patient, has a very poor prognosis.
Within 15 minutes of thrombolysis and having high quality chest compressions the amplitude of capnograph waveform rises abruptly as shown below. What does this indicate?

The EtCO2 trace can be considered a measure of cardiac output during resuscitation. An abrupt increase in EtCO2 as seen above indicates Return of Spontaneous Circulation(ROSC). An increase of at least 10mmHg is highly specific for ROSC, however specific cut-off values should not be used(3,4).
The EtCO2 can also help us make decisions about continuing CPR. At 20 minutes it is suggested that if the EtCO2 is less than 10mmHg there is little chance of survival. However if it is greater than 20mmHg at this time, there is a high chance of ROSC and cardiac compressions and resuscitation should continue.(5,6)
….Back to the patient. Your patient’s blood pressure rises to normal and the EtCO2 trace also normalises. It appears that the CPR and thrombolysis have worked. The patient continues to be stable and is transferred to ICU. She is discharged from the hospital 10 days later, to return to her new baby.
You’ve had a busy day! Time for a coffee.
I hope this short review of capnography was helpful. This is an important area that we must know, given its uses in the emergency department.
References
- Kelly JJ, Eynon CA, Kaplan JL, et al. Use of tube condensation as an indicator of endotracheal tube placement. Ann Emerg Med 1998;31:575–8.
- Chopin C, Fesard P, Mangalaboyi J, et al. Use of capnography in diagnosis of pulmonary embolism during acute respiratory failure of chronic obstructive pulmonary disease. Crit Care Med 1990;18: 353–7.
- Nassar BS, Schmidt GA. Capnography during critical illness. Chest 2016;149(2):576–85.
- ThompsonJE,JaffeMB.Capnographicwaveformsinthemechan- ically ventilated patient. Respir Care 2005;50:100–8. discussion 108–9.
- Sanders AB, Kern KB, Otto CW, et al. End-tidal carbon dioxide monitoring during cardiopulmonary resuscitation. A prognostic indicator for survival. JAMA 1989;262:1347–51.
- Levine RL, Wayne MA, Miller CC. End-tidal carbon dioxide and outcome of out-of-hospital cardiac arrest. N Engl J Med 1997;337: 301–6.
Dr Peter Kas


Excellent job!!!
Capnography – Resus
[url=http://www.gyf67fch72rhleba7g5c7c668398183qs.org/]uvvejkrfbyk[/url]
avvejkrfbyk
vvejkrfbyk http://www.gyf67fch72rhleba7g5c7c668398183qs.org/
Burberryバーバリーバッグコピー
Automatic Floor Cleaning Robot
Bamboo Charcoal Toothpaste
スーパーコピーバッグ
Experts Weigh In On The Future of The Local Livestream – 303 Magazine
Diorディオール帽子スーパーコピー
スーパーコピーブランド
CNC Machining Parts Drone
Grinding Machine Price
ブランド時計コピー